4
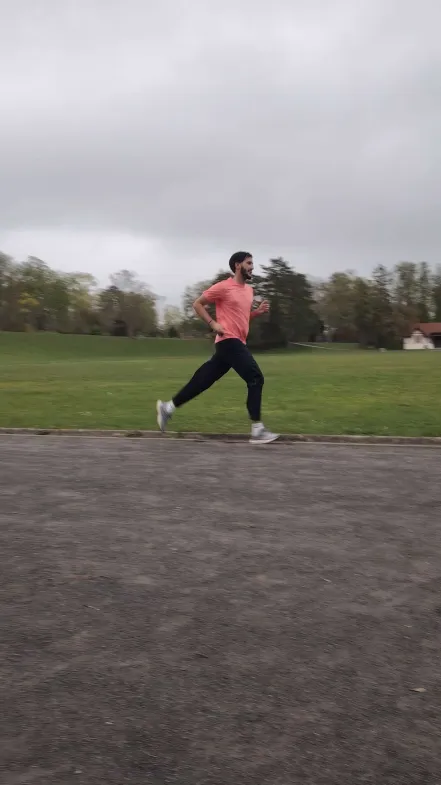
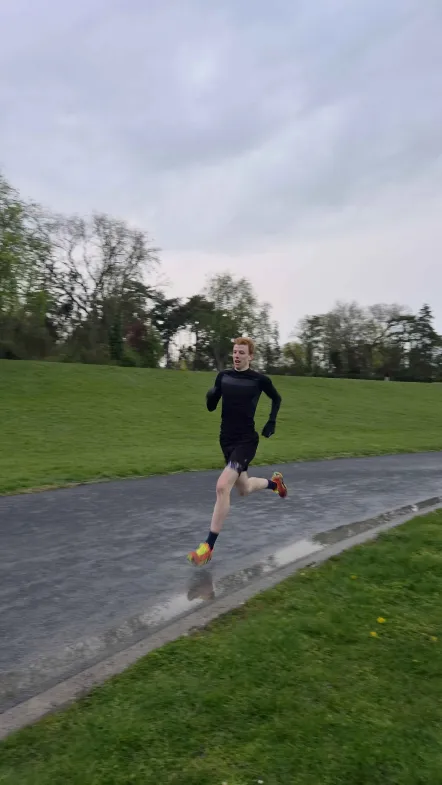
Runners
4
Sessions
400m
Distance
1
Objective
01: Equipment
Two data sources
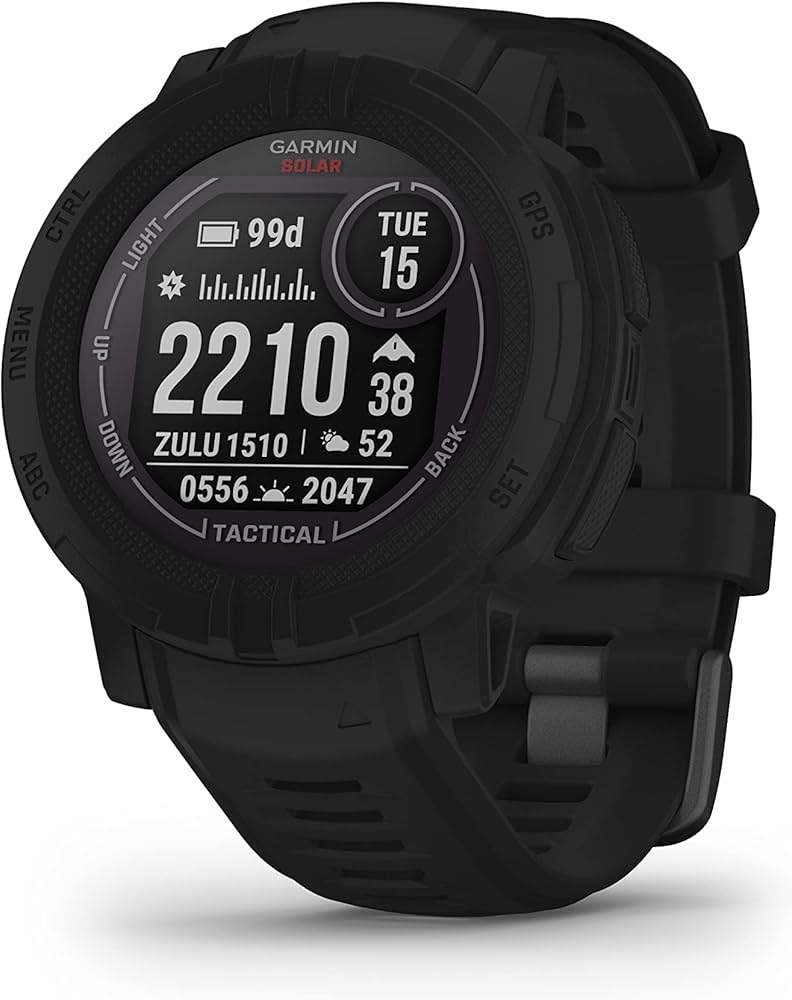
The collection setup combines a multi-sensor Garmin watch for movement data and a Polar optical sensor for cleaner heart-rate tracking.
Garmin Instinct 2
GPS 1 Hz: position, distance, instant speed
Heart rate + cadence + estimated power
Second-by-second FIT export → Python
Why it matters
This watch provides the backbone of the project: route geometry, speed evolution, cadence and estimated power, all at second-level resolution.
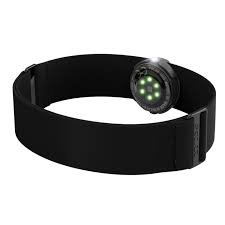
Polar OH1+
Arm optical sensor: high-frequency heart rate
Cross-validation with Garmin
Reduced motion artifacts
Metrics
Speed (m/s)
HR (bpm)
Power (W)
Captured
Cadence (spm)
GPS distance (m)
Lat/Lon coordinates

Field
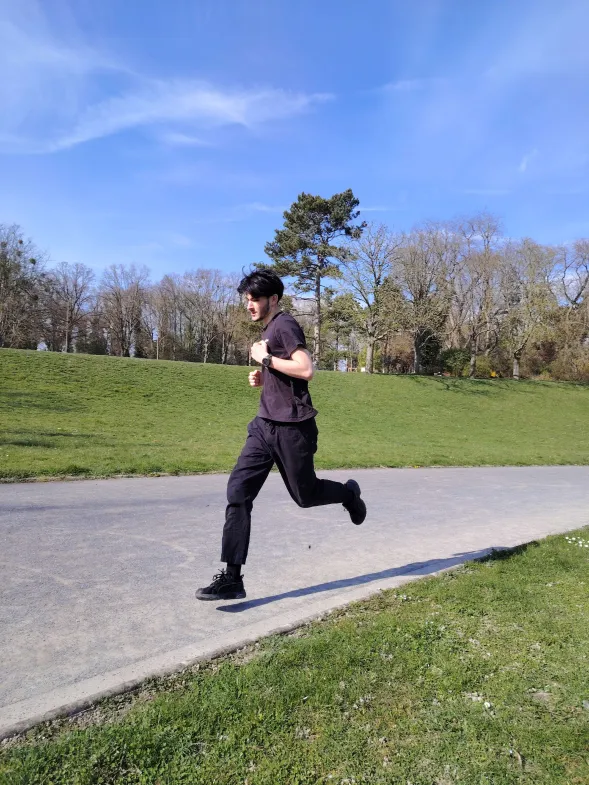
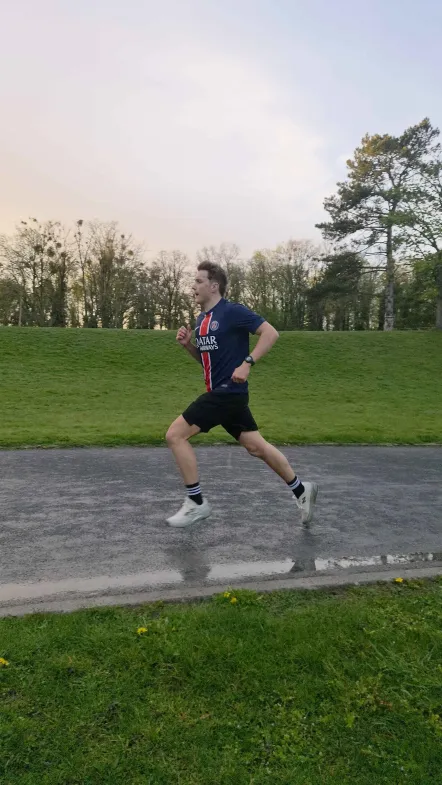
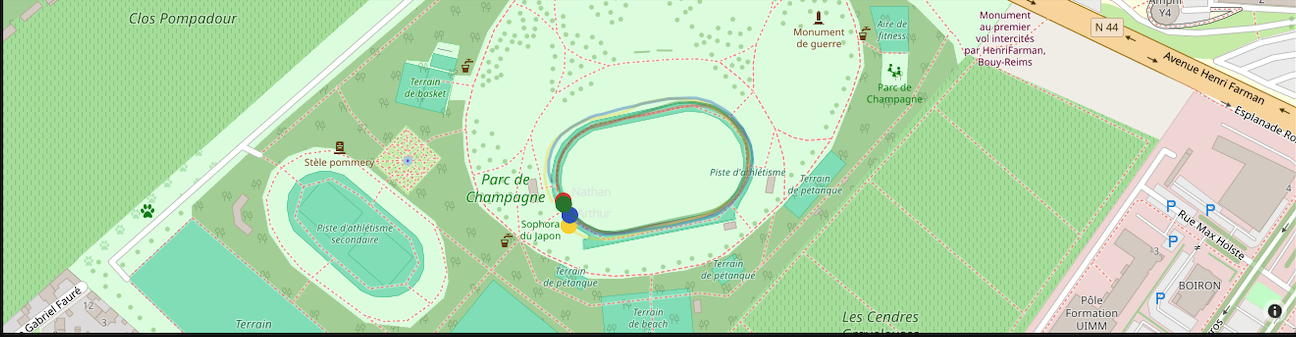
Parc de Champagne
Reims · 49.2408°N 4.0543°E · 400m asphalt track
S1
March 12 · 5:30 PM
12.5°C · wind 23.6 km/h · dry
S2
March 19 · 3:00 PM
15.4°C · wind 15.1 km/h · dry
S3
March 25 · 6:30 PM
5.3°C · wind 23.6 km/h · rain 1.4mm
S4
March 30 · 9:30 AM
7.8°C · wind 16.7 km/h · humidity 87%
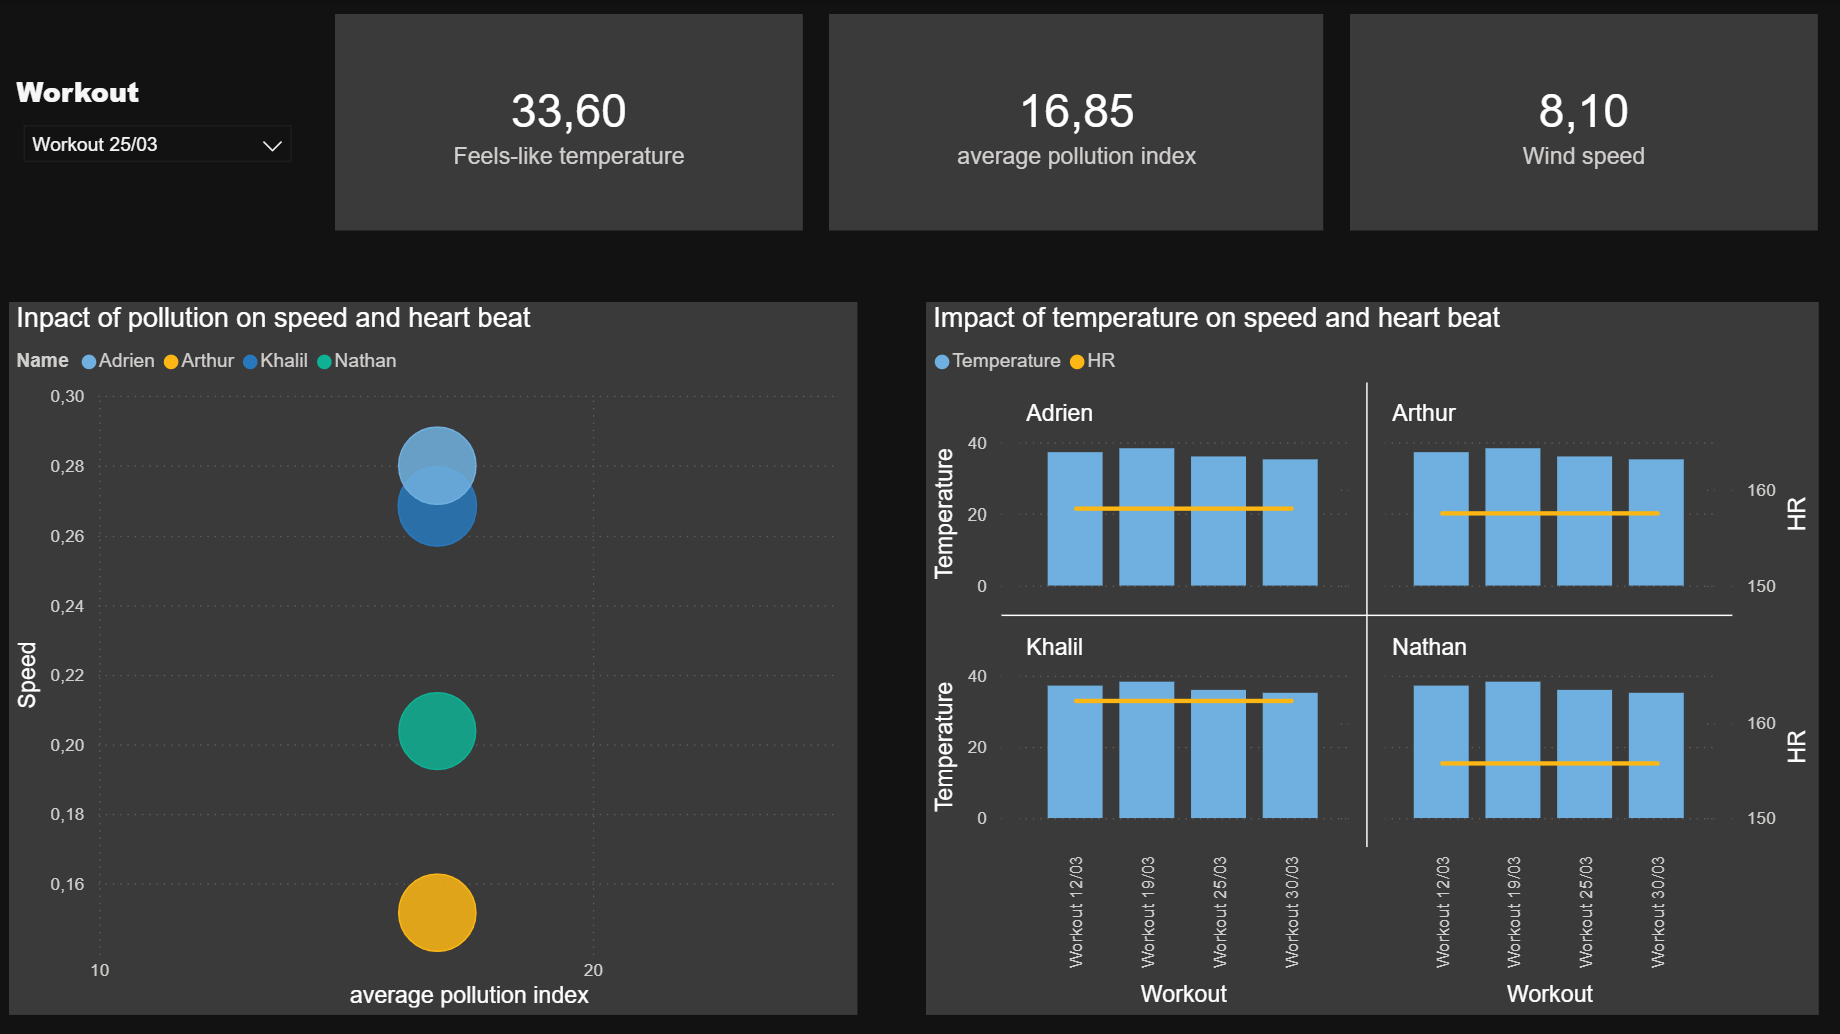
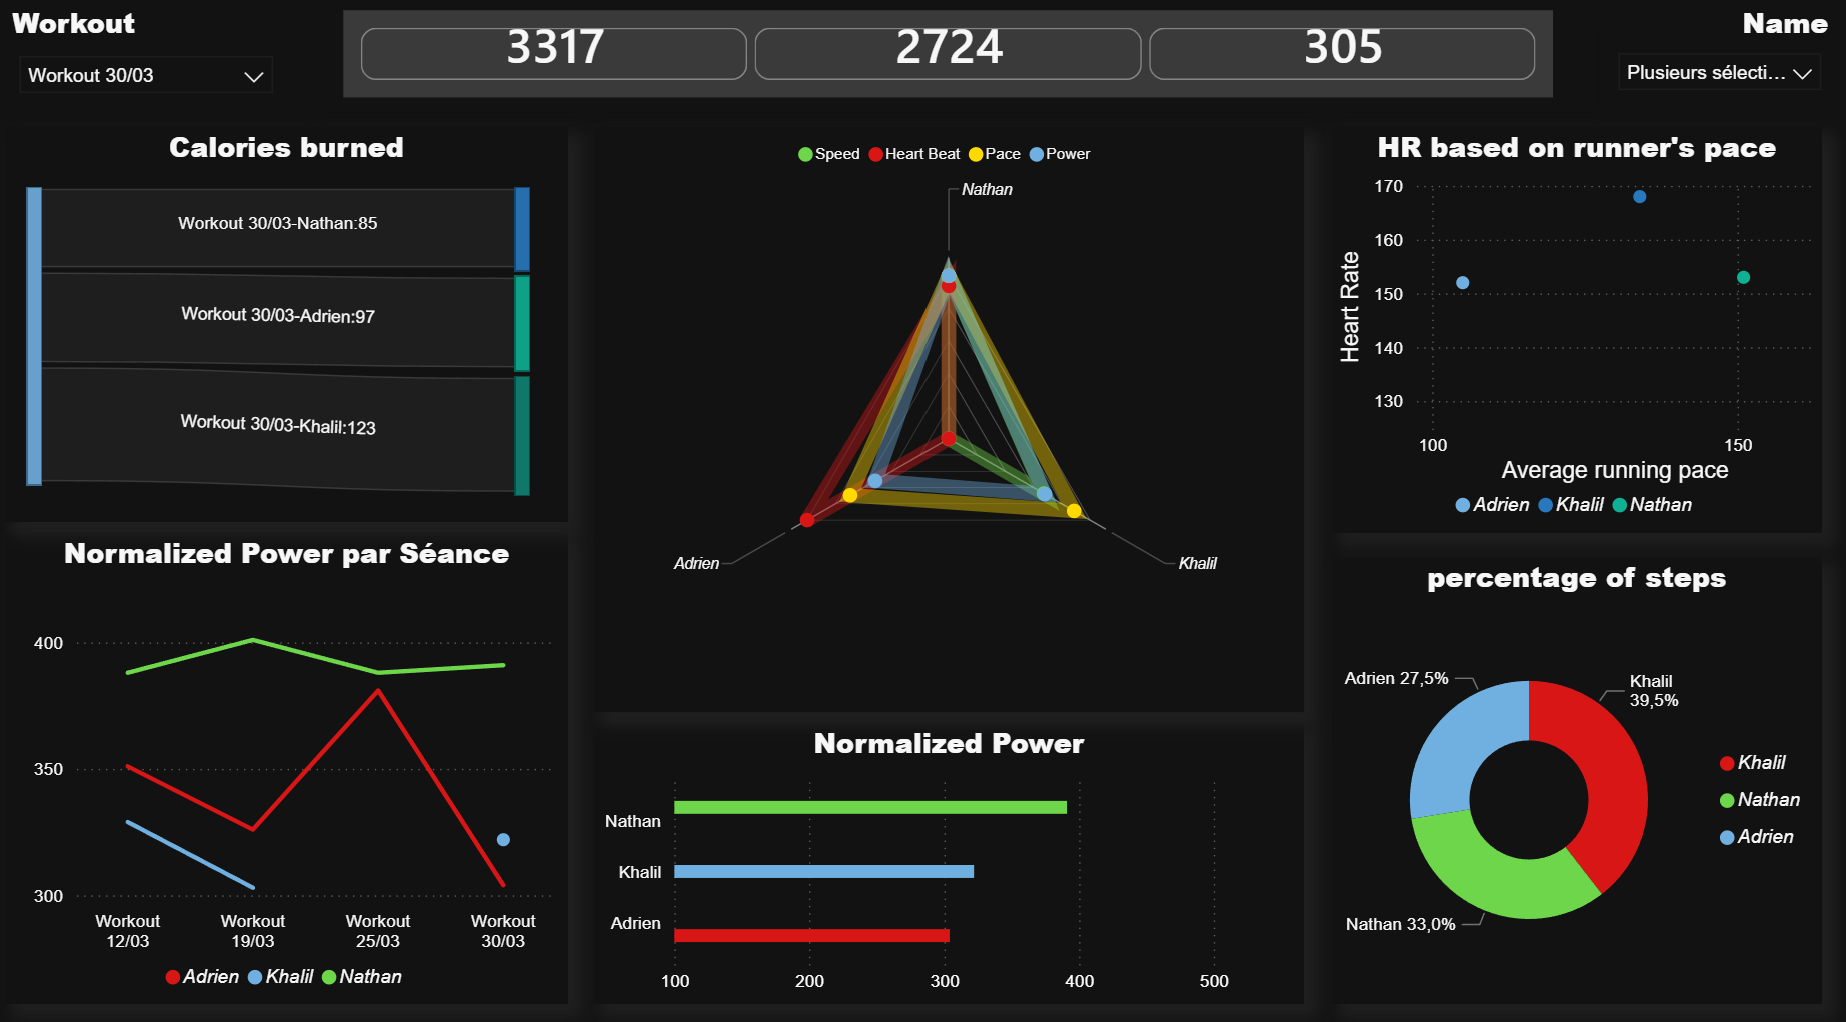
Live demo
Live Demo
Interactive dashboard based on real data: 15 runs, 4 sessions, and 4 runners.
03: Power BI · Report
Power BI report